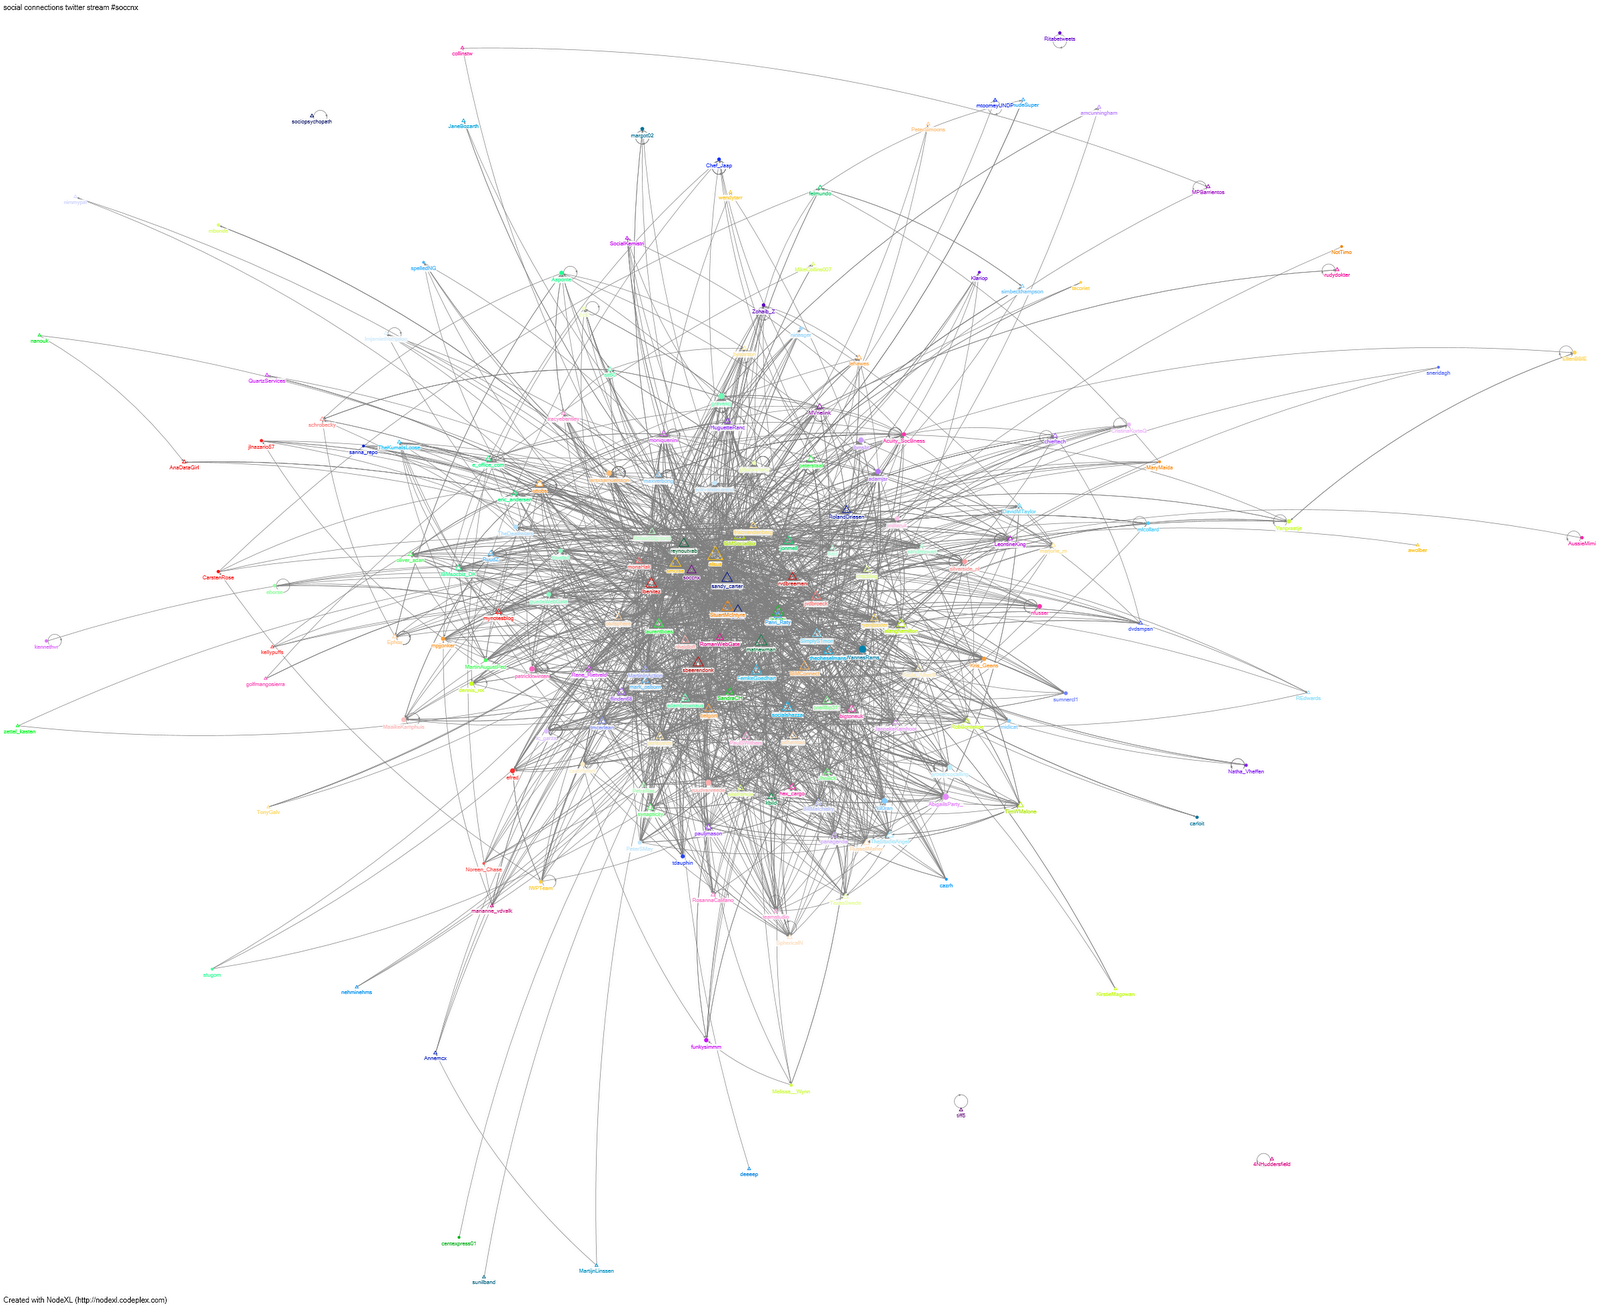
As usual there is quite a bit of tweeting going on during an event, and Social Connections is no exception. The hashtag for the event is #soccnx. Doing some network analysis delivers a great graph of the Social Connections IV community. The graph displays all the connections between attendees (and even non-attendees) that have tweeted #soccnx.
 |
| Graph of #soccnx twitter network during Social Connections IV |
Social Connections community is tightly connected
The graph is compiled of 210 vertices (nodes) and 4010 edges (links). These are the twitter accounts and their connections to eachother. The average geodesic distance is 2,113666 and the maximum still only 4 - meaning that the Social Connections community is a tightly connected community. On average every person is only two links away and the maximum is 4 degrees of separation. So even less than the famous (unproven) theory 6 degrees of separation. Just exactly how close everybody involved is to one another is also apparent from the number of connected components: there are only 5 'subgraphs' of tweeters that are connected to each other but not to anyone in one of the other subgraphs.
When digging deeper into the table underlying the graph I can give some insight in various types of measures of the centrality of a vertex within a graph that determine the relative importance of a vertex within the graph
(devided into degree, closeness centrality, betweenness centrality, eigenvector centrality and PageRank).
 |
| Top 20 vertices (tweeters) by Eigenvector Centrality |
The top names are not surprising. They are the ones organising the event, speakers, IBM employees or very influential people in the IBM social business arena.
Geen opmerkingen:
Een reactie posten